Understanding Lighting Metrics for Your Specific CEA Operation
 July 8, 2025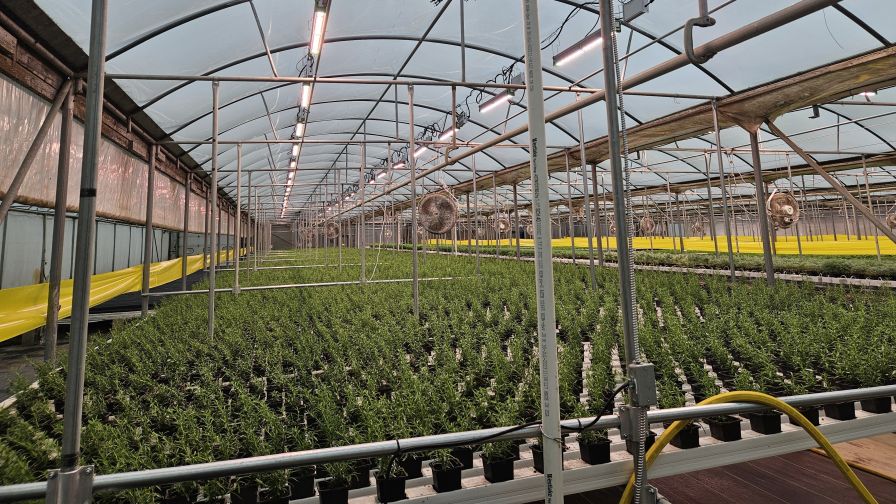
Using essential lighting quantifications and strategic planning factors will help you choose the right lighting plan for your CEA facility. | Photo: TotalGrow Lights
After spending 13 years in horticultural LED lighting, I’ve seen countless growers struggle with the same challenge: navigating the overwhelming detail of lighting metrics and marketing claims to determine what actually matters for their operation. The difference between successful projects and expensive disappointments often comes down to understanding critical quantifications in lighting and their practical applications.
The Foundation: Photon-Based Measurements
Plants respond to photons, not lumens or watts. The quantum nature of photosynthesis makes counting photons far better than human-vision metrics (lumens, lux, foot-candles).
Daily light integral (DLI) is the most critical number you’ll plan around. Expressed in moles per square meter per day (mol/m²/day), DLI represents the total photon energy available to plants over a 24-hour period. This single metric best predicts plant growth from a lighting perspective. Too little total energy means poor results regardless of other factors, while a high DLI can compensate for other environmental limitations.
Other metrics worth noting are:
- Photon flux (PPF or PF), which measures the total photons emitted, expressed in micromoles per second (µmol/s). Think of this as a sprinkler’s flow rate—how much “water” (photons) comes from your light fixture. This indicates the light’s raw output capacity.
- Photon flux density (PPFD or PFD), which measures the accumulation rate or intensity of photons at a plant surface (µmol/m²/s). Picture plants as buckets—PPFD shows how quickly they fill with photons. Head lettuce requires around 250-300 µmol/m²/s, while tomatoes require 400-600 µmol/m²/s or higher.
Many factors influence which numbers are the most strategic to target, but the following table provides a general idea of guidelines for crops at different stages of growth in sole source (no sunlight) and supplemental (greenhouse) settings:


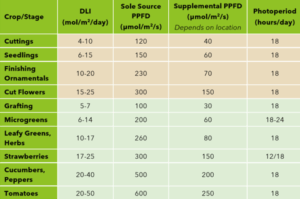
Typical lighting intensities used for different crops.
The Economic Reality: Light Efficacy
Photon flux efficacy measures photons produced per watt of electricity consumed (µmol/J, micromoles per joule). This metric directly impacts operational costs, ROI, and maximum light output if power capacity is limited.
Lower efficacy lights typically cost less upfront but more to operate, while higher efficacy options require a higher initial investment but reduce ongoing power costs. Find the optimal balance for your situation—if using lights for only one to three months annually, prioritizing initial cost savings often beats investing in maximum efficiency with year-round light usage.
The Practical Challenge: Uniformity
Light uniformity determines whether your growing area performs consistently. While there’s no standardized measurement method (yet), the goal is to minimize variation between the brightest and darkest areas of your operation.
If more than 90% of your grow area falls within 10% of the average intensity, that is considered excellent.
If more than 25% of your grow area deviates by more than 50% of the average, that’s considered poor uniformity. This can cause problematic variations in growth rates, finish times, quality, and nutrient uptake.
Spectrum Considerations: Beyond the Hype
While photon quantity drives growth, spectrum quality affects plant morphology and secondary characteristics, though quantity and quality actually interact. Here is another useful simplification of what matters practically:
- Blue light (400-500 nanometers) encourages compact, dense growth with higher secondary metabolite concentrations—stronger flavors, colors, and nutrition—but typically reduces total biomass.
- Green light (500-600 nanometers) has less distinctive morphological impacts, driving general growth with helpful penetration for larger plants under higher PPFDs and improving the visual work environment.
- Red light (600-700 nanometers) drives photosynthesis most efficiently and acts as the backbone of most grow lights due to LED efficiency advantages, especially for smaller plants and lower-light conditions.
- Far-red light (700-750 nanometers) triggers expansion responses, increasing leaf area and growth rate, especially when canopy coverage is incomplete.
For most applications, balanced full-spectrum lighting resembling natural sunlight provides reliable, desirable results.
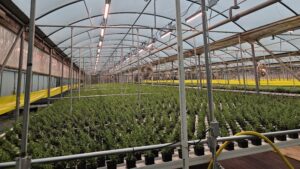
This Michigan greenhouse needed supplemental lighting to create optimal growing conditions during the winter months. | Photo: TotalGrow Lights
Applying These Metrics Strategically
- All these quantifications work together to guide practical decisions. A recent project with a leading Michigan herb greenhouse illustrates this: Their range of 18- by 150- foot greenhouse bays (250 m2) needed supplemental lighting to maintain optimum growth rates and quality during dark winter months.
- TotalGrow’s DIY planning calculator suggested a 17+ mol/m2/day total DLI target, but typical west Michigan winter days only reliably provide approximately 4 mol/m2/day on average. Running lights on 18-hour photoperiods requires 200 µmol/m2/s PPFD to add the missing 13 moles of DLI.
- The greenhouse setup’s limited height, small aisles, particular incentive opportunities, and moderate annual usage hours resulted in a great fit for standard efficacy, high-powered HI-Top 660W lights with 1685 µmol/s photon flux, each in two2 rows down these 18-foot bays. After factoring in losses and setup details, these lights cover about 75 square feet (7 m2) each at this relatively high 200 PPFD average intensity, resulting in two lines of lights on 8-foot centers down the bays.
Moving Forward with Confidence
Understanding these vital quantifications provides the foundation for successful lighting projects, but that’s just the beginning. As noted above, environmental factors, budget constraints, utility programs, and operational considerations all influence your optimal strategy.
The key is using these metrics as decision-making tools rather than absolute targets. Every operation has unique constraints and opportunities affecting the ideal balance of light quantity, quality, efficiency, and cost.
Ready to apply these quantifications? Start by calculating your target DLI based on crops and growth goals, then work backward through photoperiod and intensity requirements. The numbers will guide you toward solutions that optimize both plant performance and business outcomes.